Sometime we need to find a way to centralize all log from application no matter what is the kind of deployment they are, from a process on a Virtual Machine to a containerized application.
Today in the scope of this post i will guide you to collection log from a file ( tail file), shipping them to Elastic Search and then using Kibana to view it.
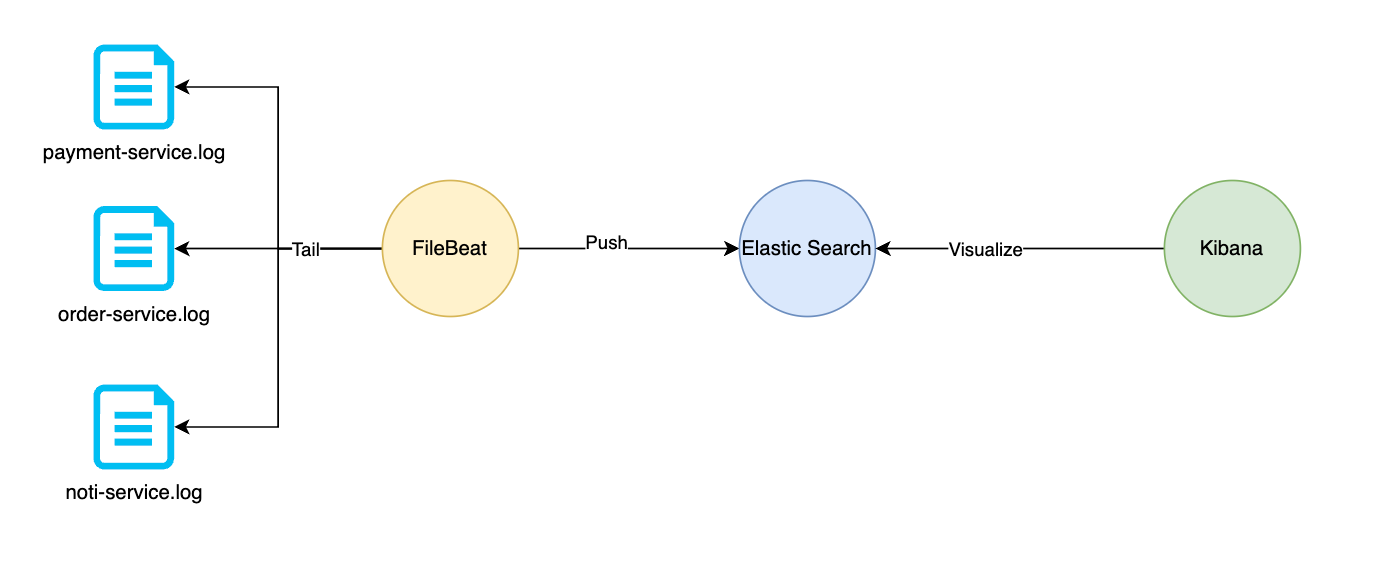
We will install ElasticSearch, Kibana using docker compose , also deploying a Filebeat container using docker.
Install Elasticsearch and Kibana
In this docker-compose.yml file, i defined 2 services, es and kibana, they was depoyed to a bridge network so they can communicate by service name.
The Elastic Search service exposed endpoint on port 9200 and Kibana exposed on port 5601.
version: "3.9"

networks:
  default:
    name: elk
    driver: bridge

volumes:
  elasticsearch:


x-service-common:
  &service-common
  restart: unless-stopped

x-es-env:
  &es-env
  discovery.type: single-node
  node.name: es01
  cluster.name: es-docker-cluster
  bootstrap.memory_lock: true
  ES_JAVA_OPTS: -Xms512m -Xmx512m
  xpack.security.enabled: true
  ELASTIC_PASSWORD: &elastic-password helloworld
  LICENSE: basic

x-kibana-env:
  &kibana-env
  SERVERNAME: kibana
  ELASTICSEARCH_HOSTS: http://es:9200
  ELASTICSEARCH_USERNAME: kibana_system
  ELASTICSEARCH_PASSWORD: &kibana-password kibanahelloworld~


services:
  es:
    <<: *service-common
    image: docker.elastic.co/elasticsearch/elasticsearch:8.5.2
    environment: *es-env
    volumes:
      - elasticsearch:/usr/share/elasticsearch/data
    ports:
      - 9200:9200
  kibana:
    <<: *service-common
    image: docker.elastic.co/kibana/kibana:8.5.2
    ports:
      - 5601:5601
environment: *kibana-envDeploy es and kibana service.
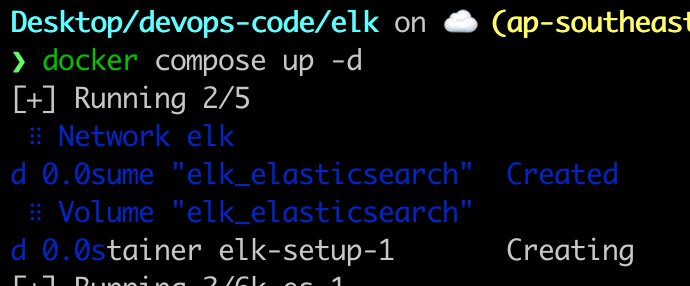
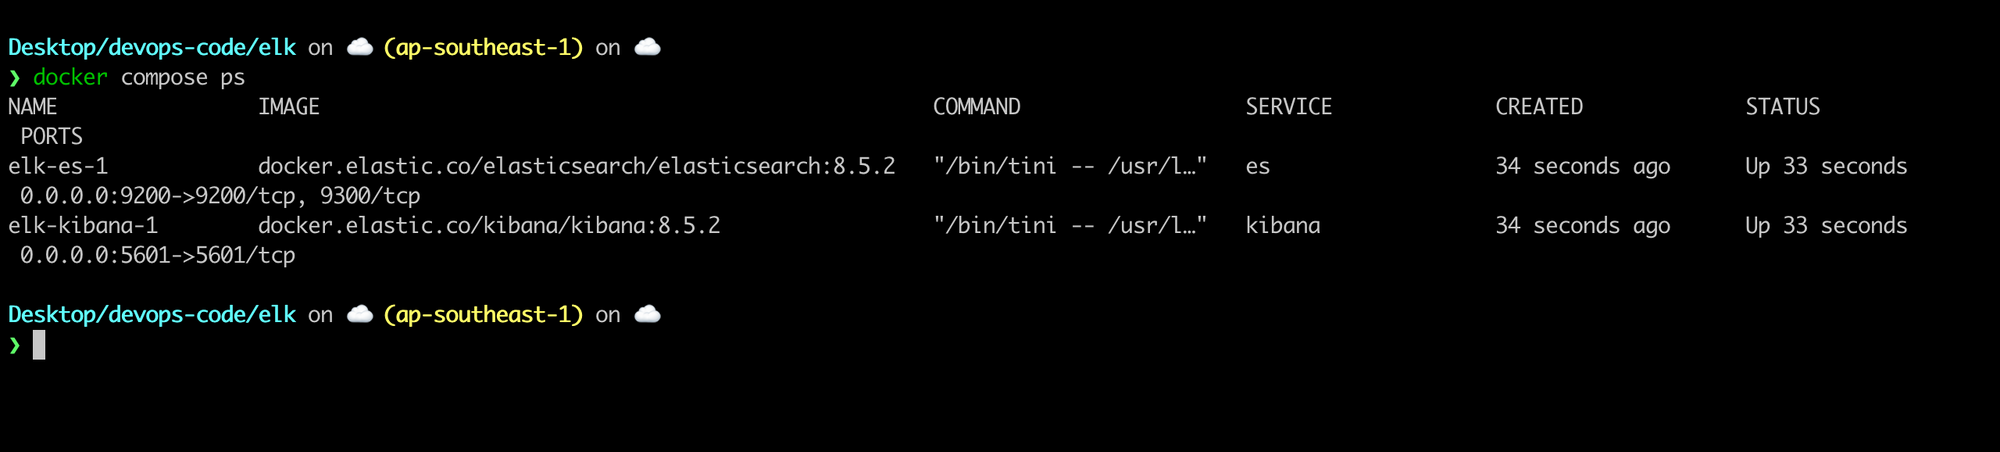
View the log using docker compose logs -f.

You can see that the kibana service could not authenticate to elasticsearch service, this is because we have not created the kibana-system user for kibana service yet.
Create kibana system user.
From host machine, run this command
curl -s -X POST -u "elastic:helloworld" \
          -H "Content-Type: application/json" \
          http://localhost:9200/_security/user/kibana_system/_password -d "{\"password\":\"helloworld~\"}"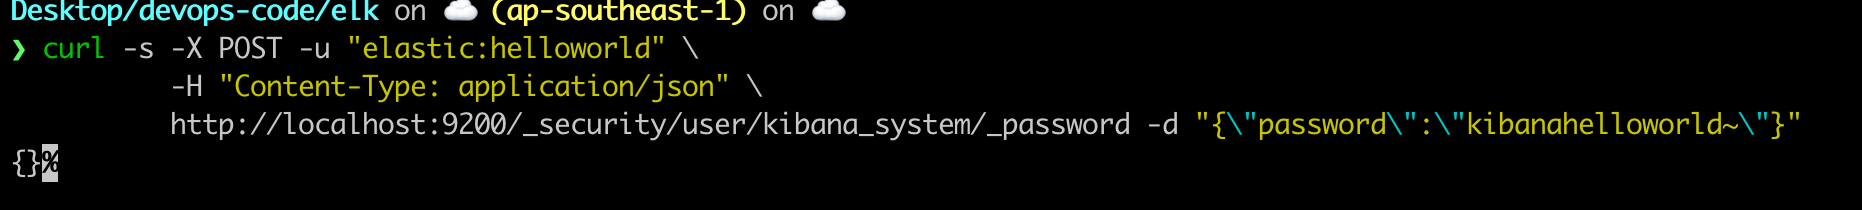
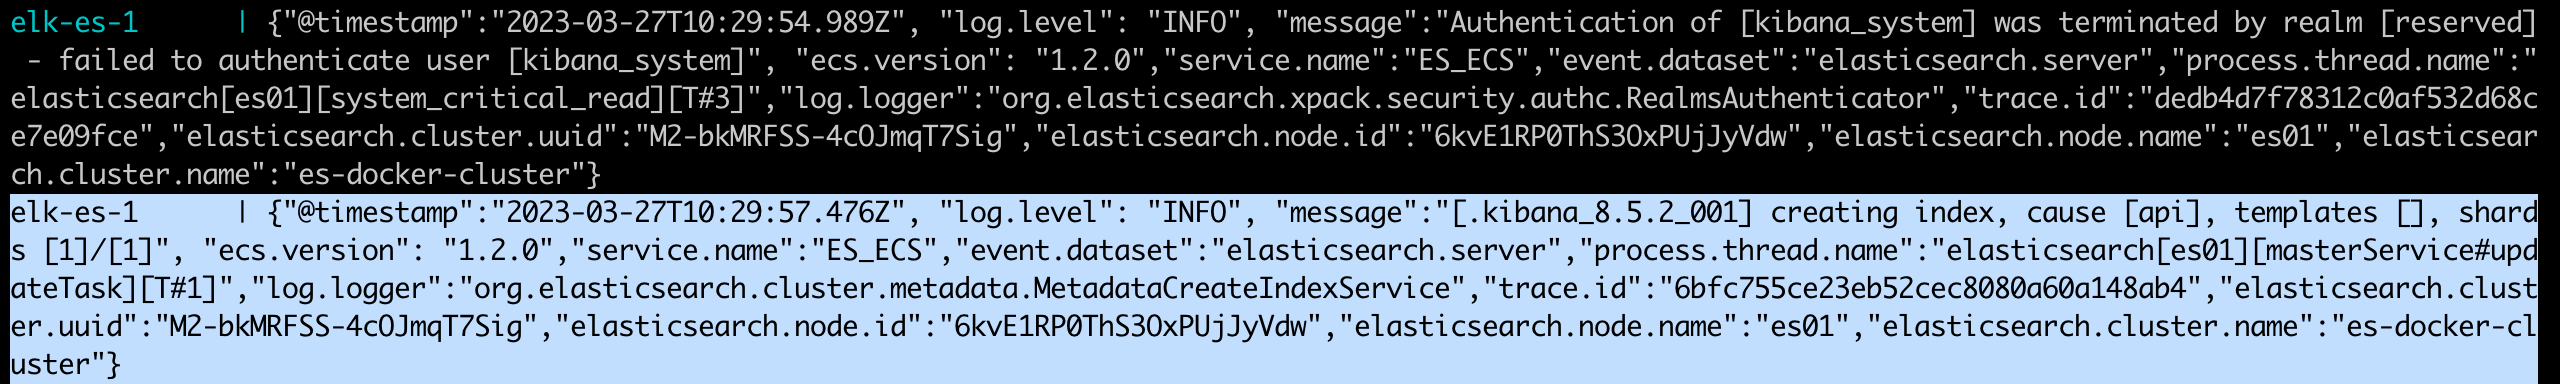
Now check the log of again, we saw that kibana service can access es service so far.
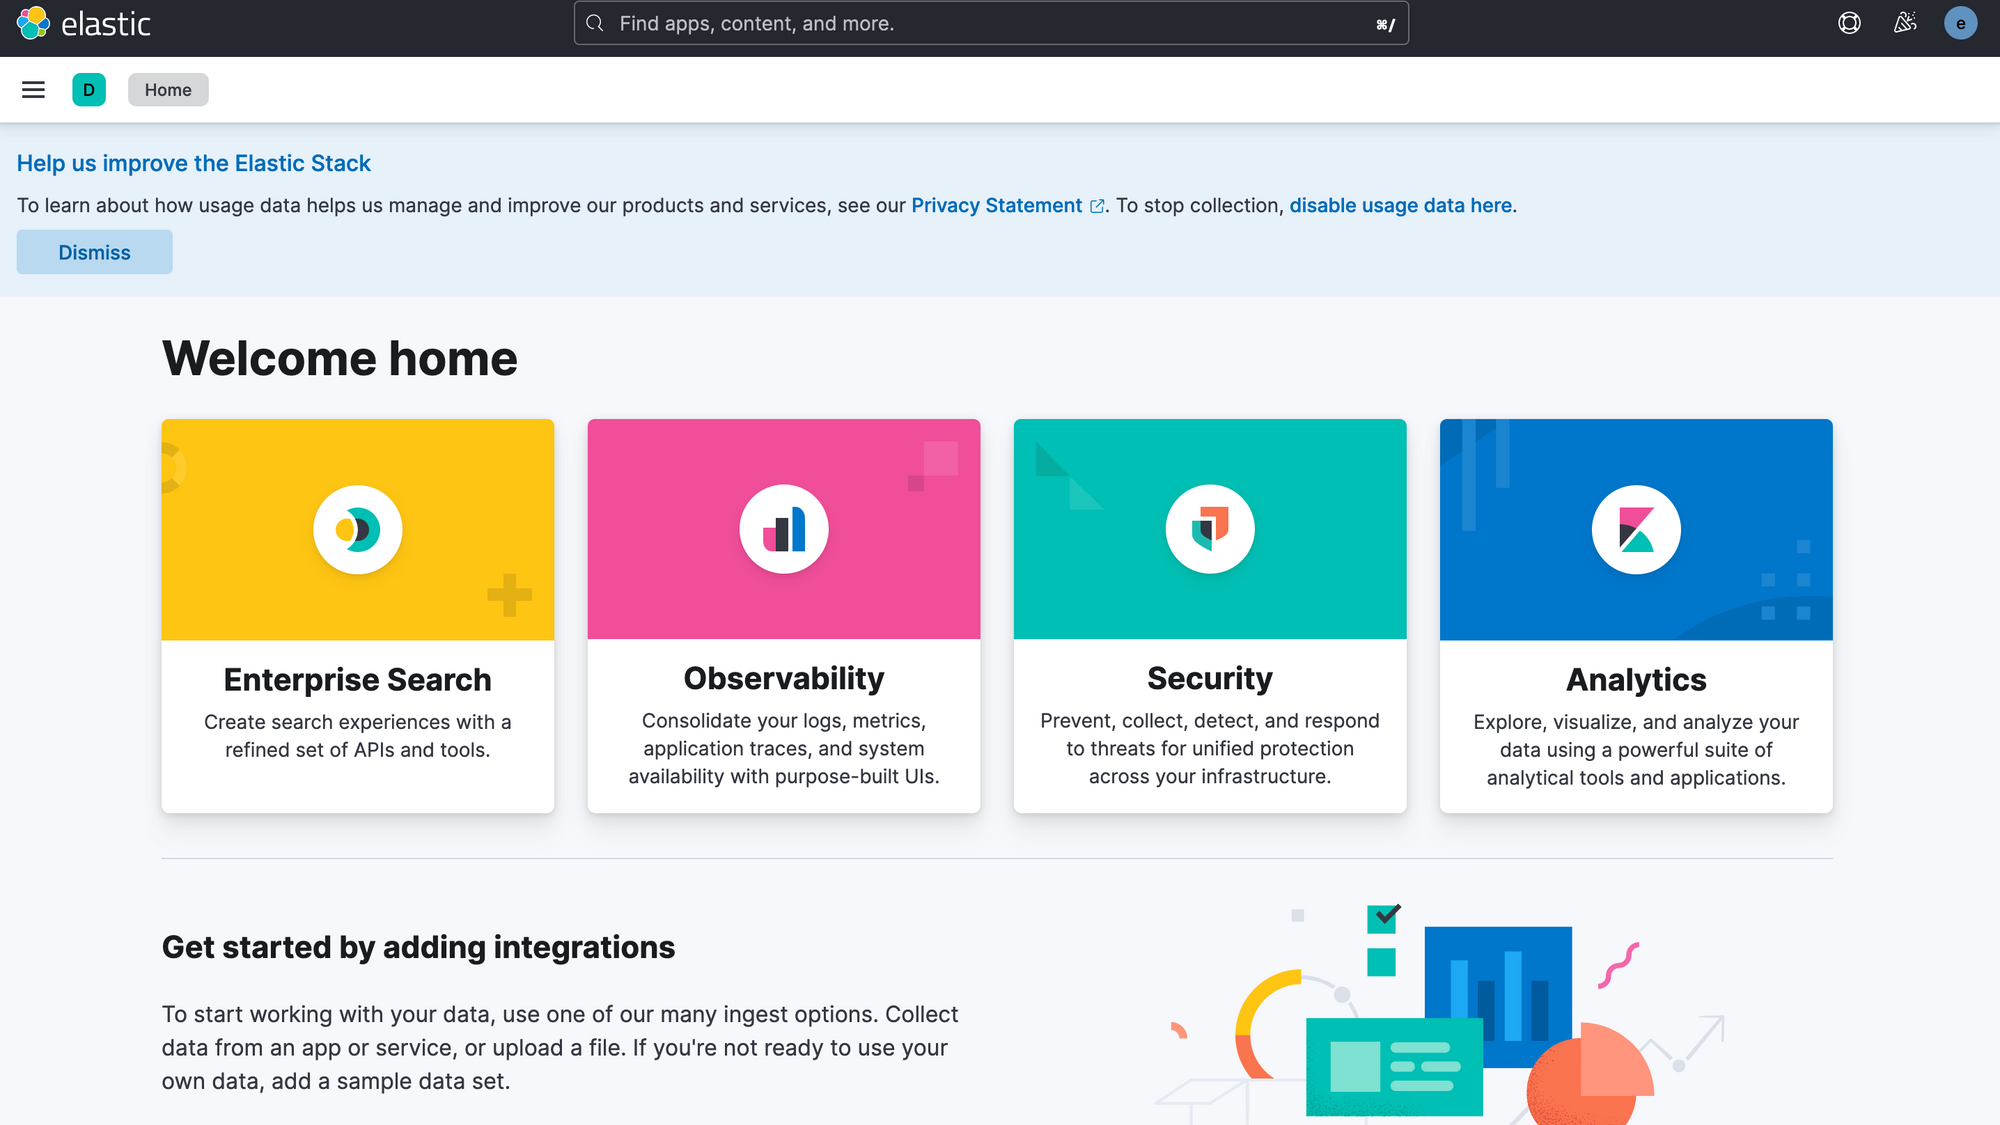
Open Kibana console
Open http://localhost:5601 on host machine, use the following username,password
username=elastic
password=helloworld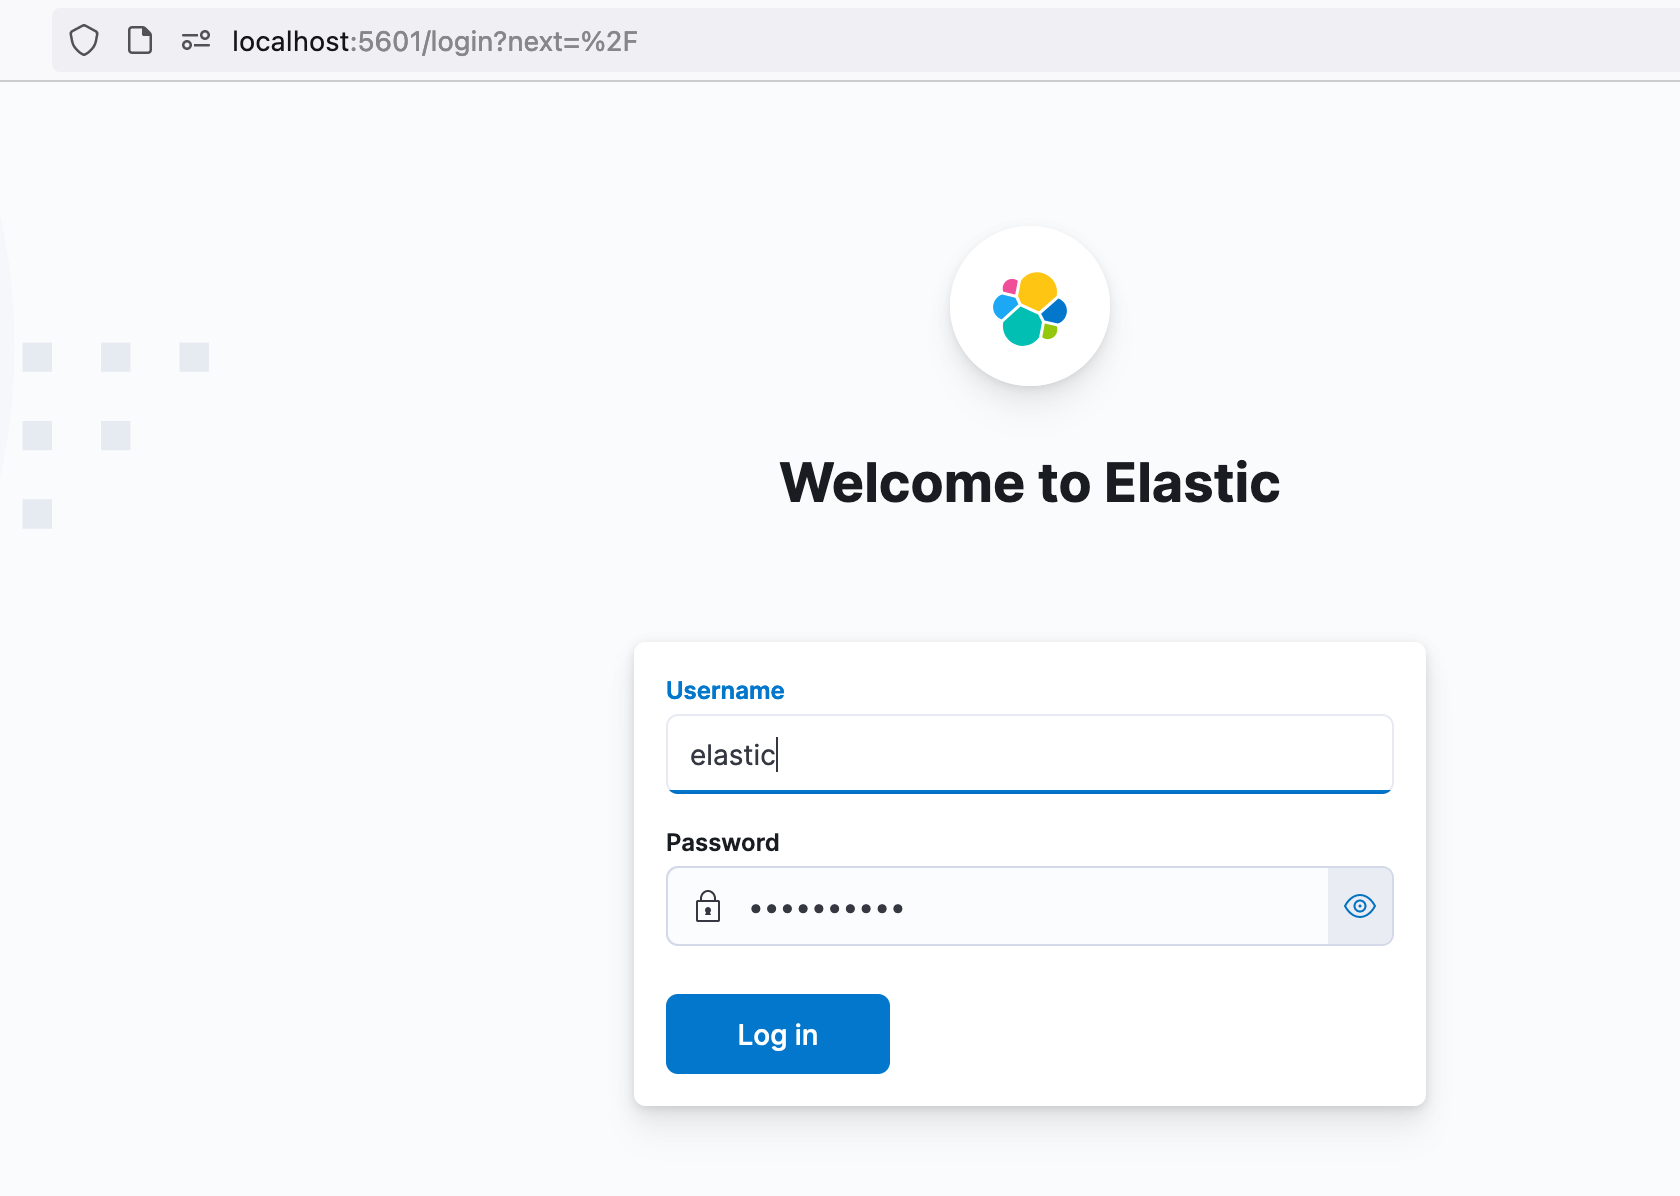
Go to Observability and view Stream section
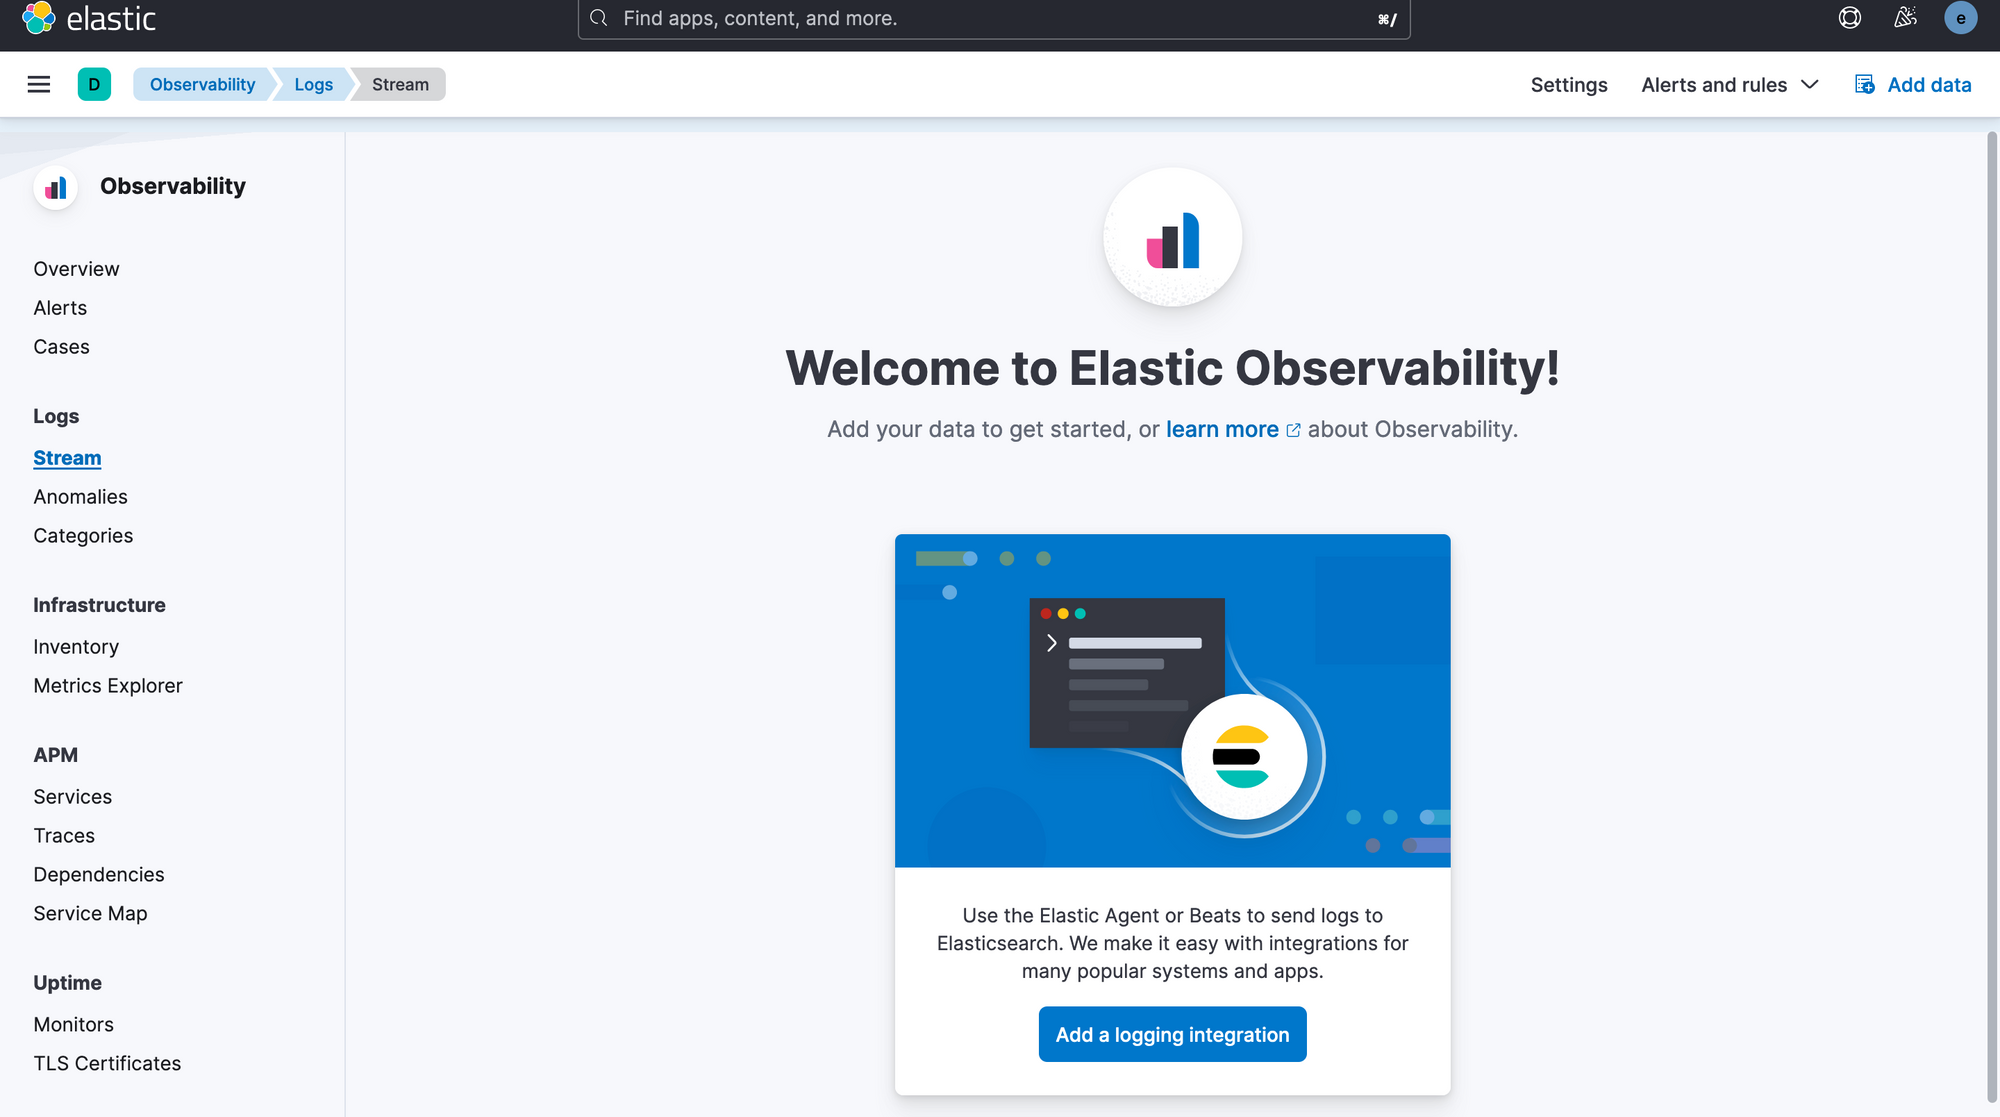
You will see no log stream there because we have not set up yet.
Deploy FileBeat.
Next, we will deploy a filebeat using docker compose . We create a producer script to continous writting to a text file meanwhile filebeat keep tailing and push the message to elasticsearch.
The docker-compose.yml file.
networks:
  default:
    name: filebeat
    driver: bridge

x-service-common:
  &service-common
  restart: unless-stopped
  image: docker.elastic.co/beats/filebeat:8.5.2

configs:
  filebeat:
    file: ./filebeat.yaml
  testlog:
    file: ./testlog.txt

services:
  filebeat:
    <<: *service-common
    user: root
    configs:
      - source: filebeat
        target: /usr/share/filebeat/filebeat.yml
      - source: testlog
        target: /test.txt
From this file above, you can see that i mounted ./testlog.txt into /test.txt inside filebeat container. I will write something onto that file after deploying filebeta.
The filebeat.yaml file.
filebeat.config:
  modules:
    path: ${path.config}/modules.d/*.yml
    reload.enabled: false

filebeat.inputs:
  - type: filestream
    id: test-log-file
    paths:
      - /test.txt
    fields:
      event.dataset: test-log-file
    fields_under_root: true

output.elasticsearch:
  hosts: "http://192.168.1.156:9200"
  username: "elastic"
  password: "helloworld"
Please change your elasticsearch host, i entered my host machine LAN ipaddress above. This is 192.168.1.156
Deploy using
docker compose up filebeat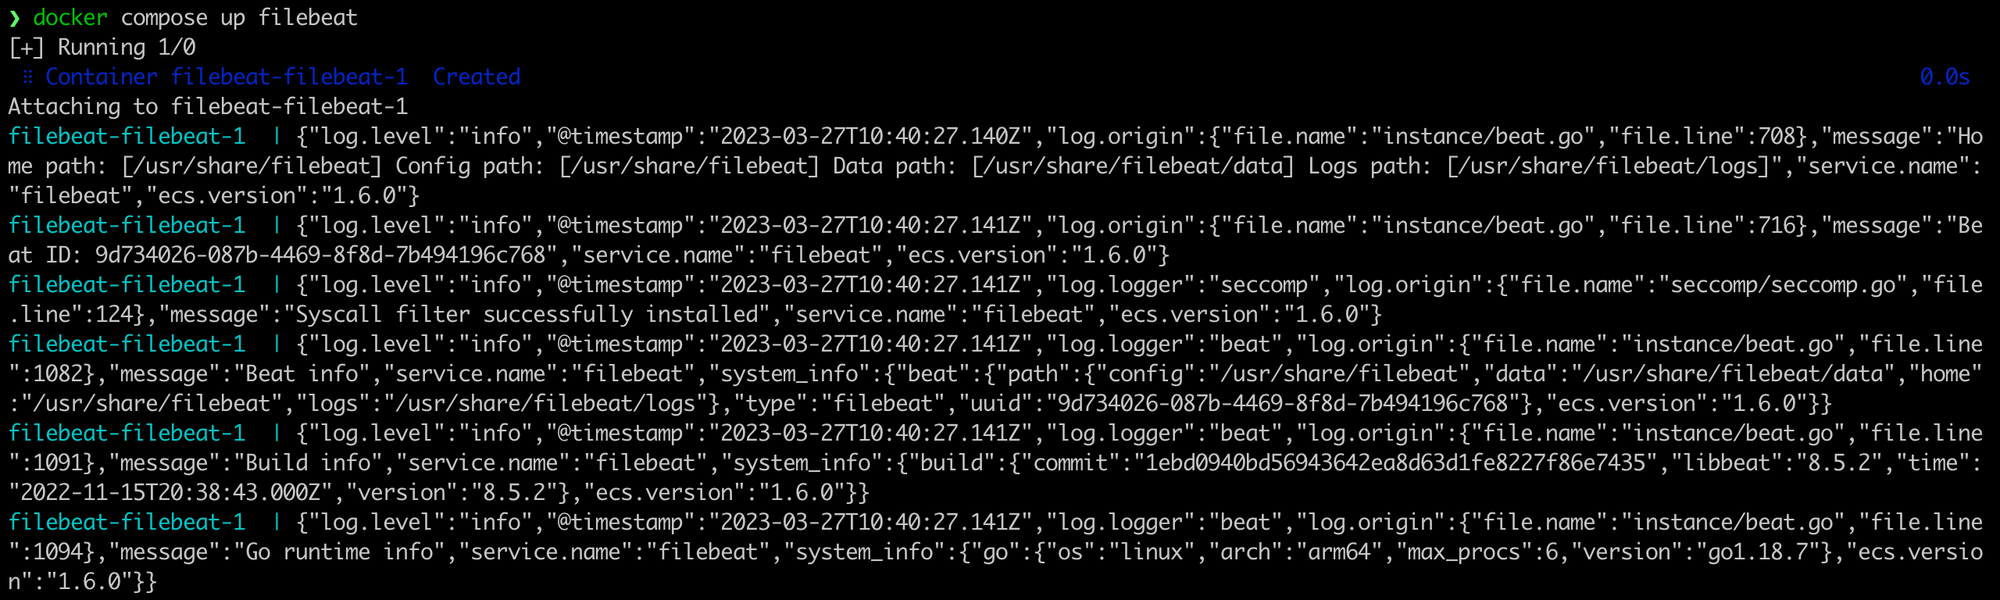
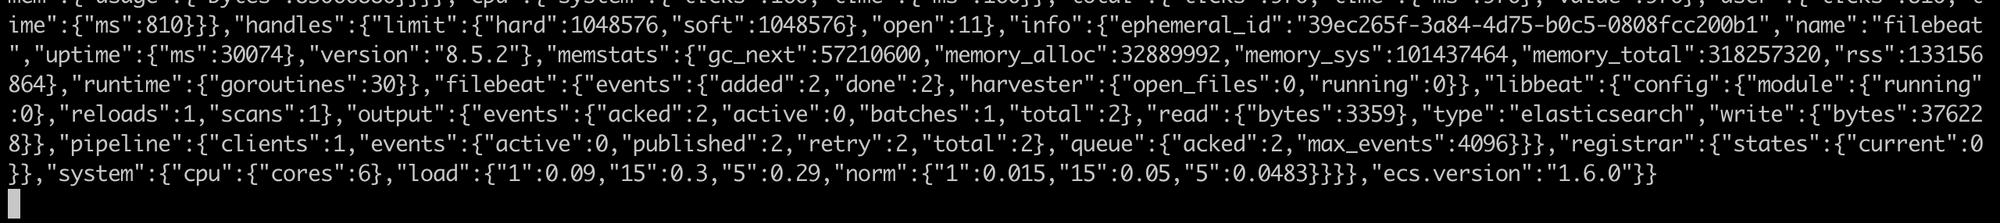
You could see that filebeat was able to connect to elasticseach
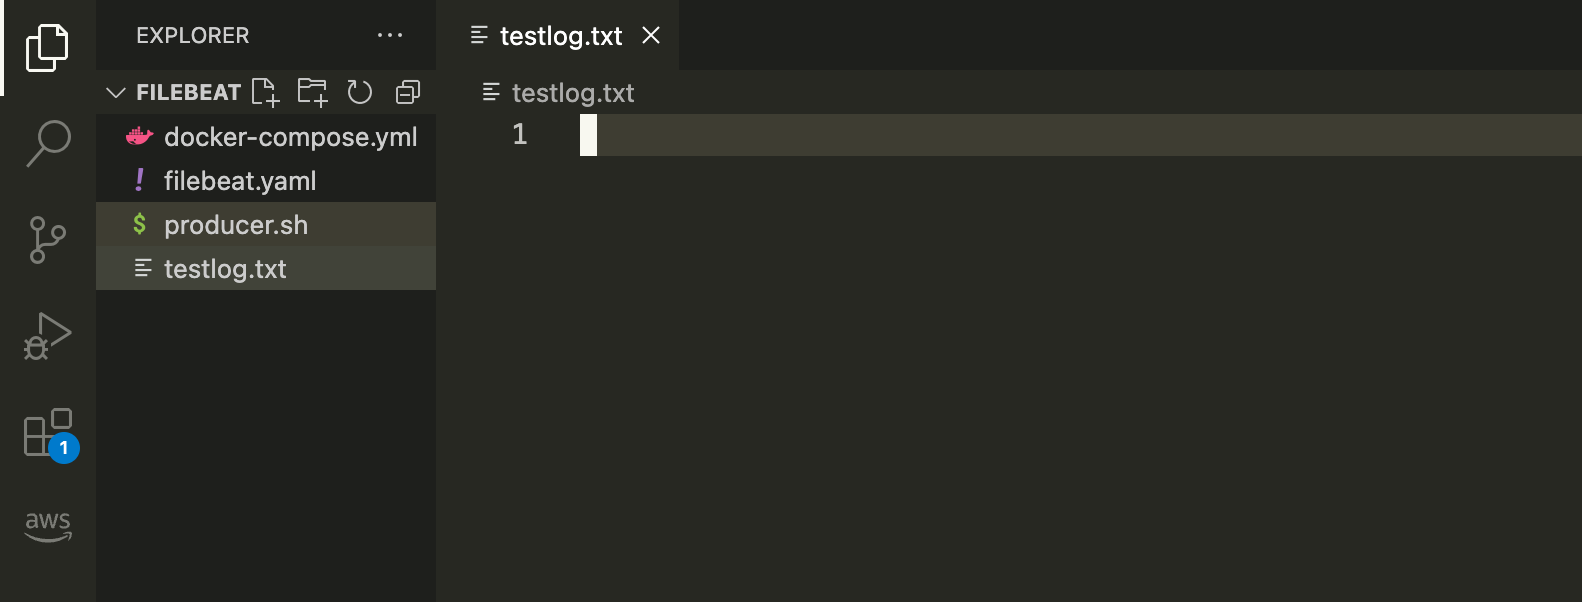
The testlog.txt is empty so far
Write a script to continuous writing log to that file
#!/bin/bash
while [[ true ]];
do
    echo "writing"
    echo "hello $(date)"  >> testlog.txt
    sleep 1
done
Run it
./producer.sh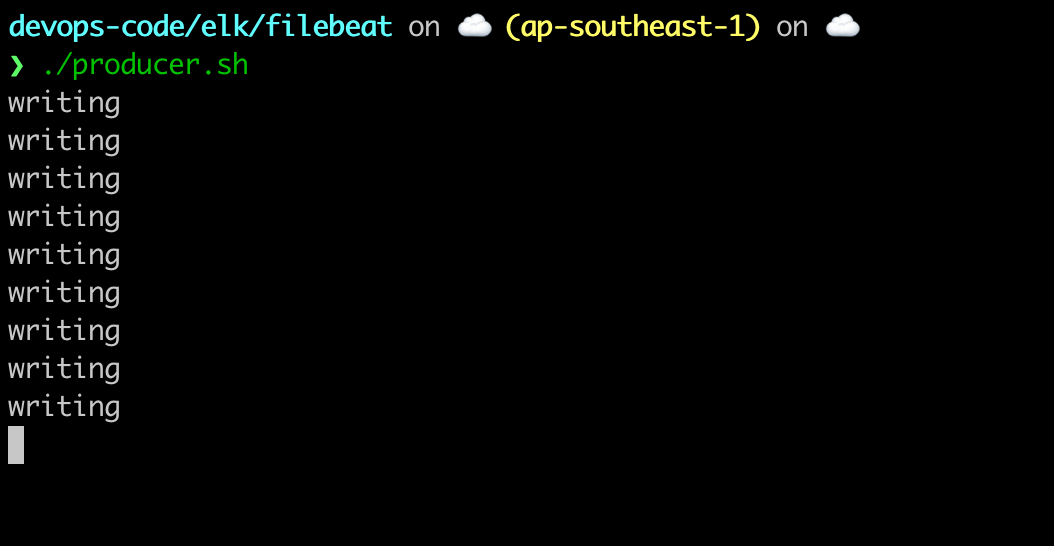
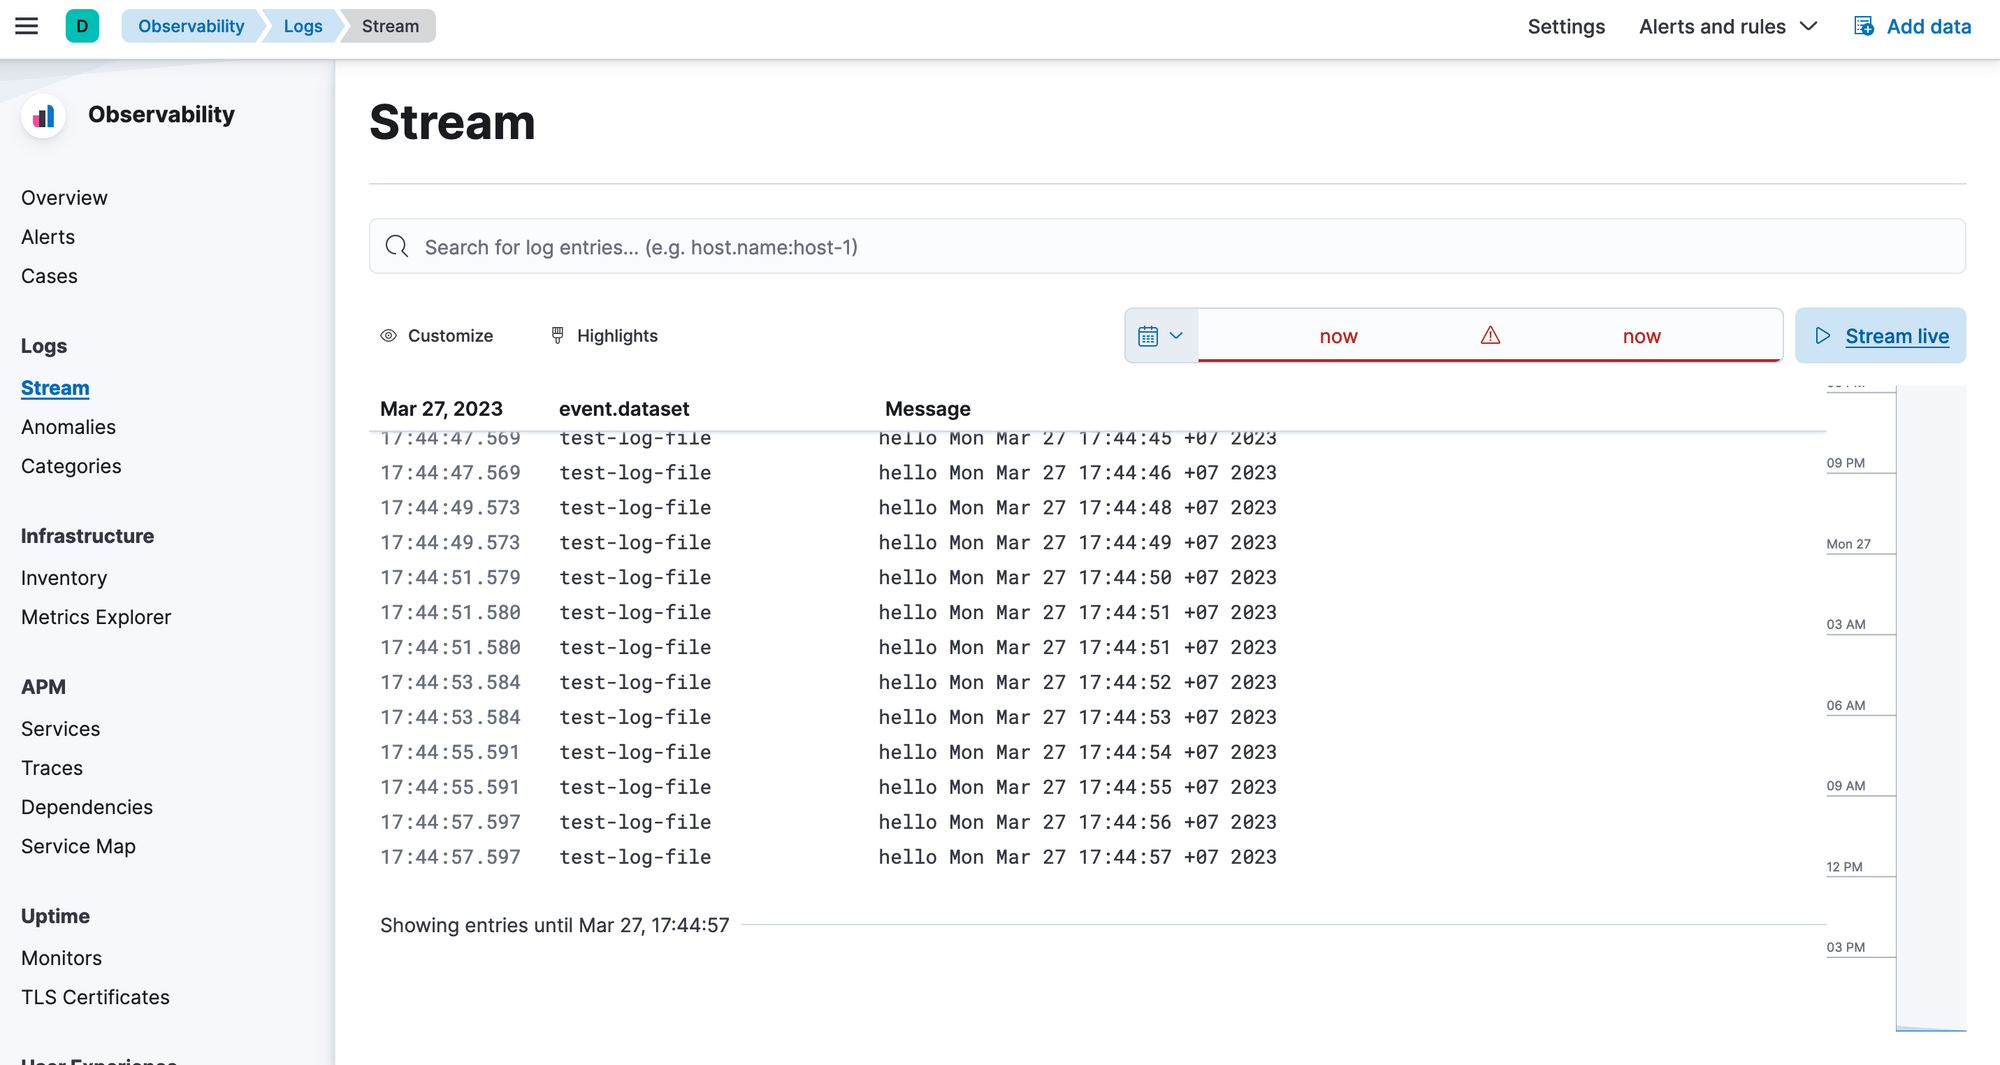
View the log in Stream Dashboard
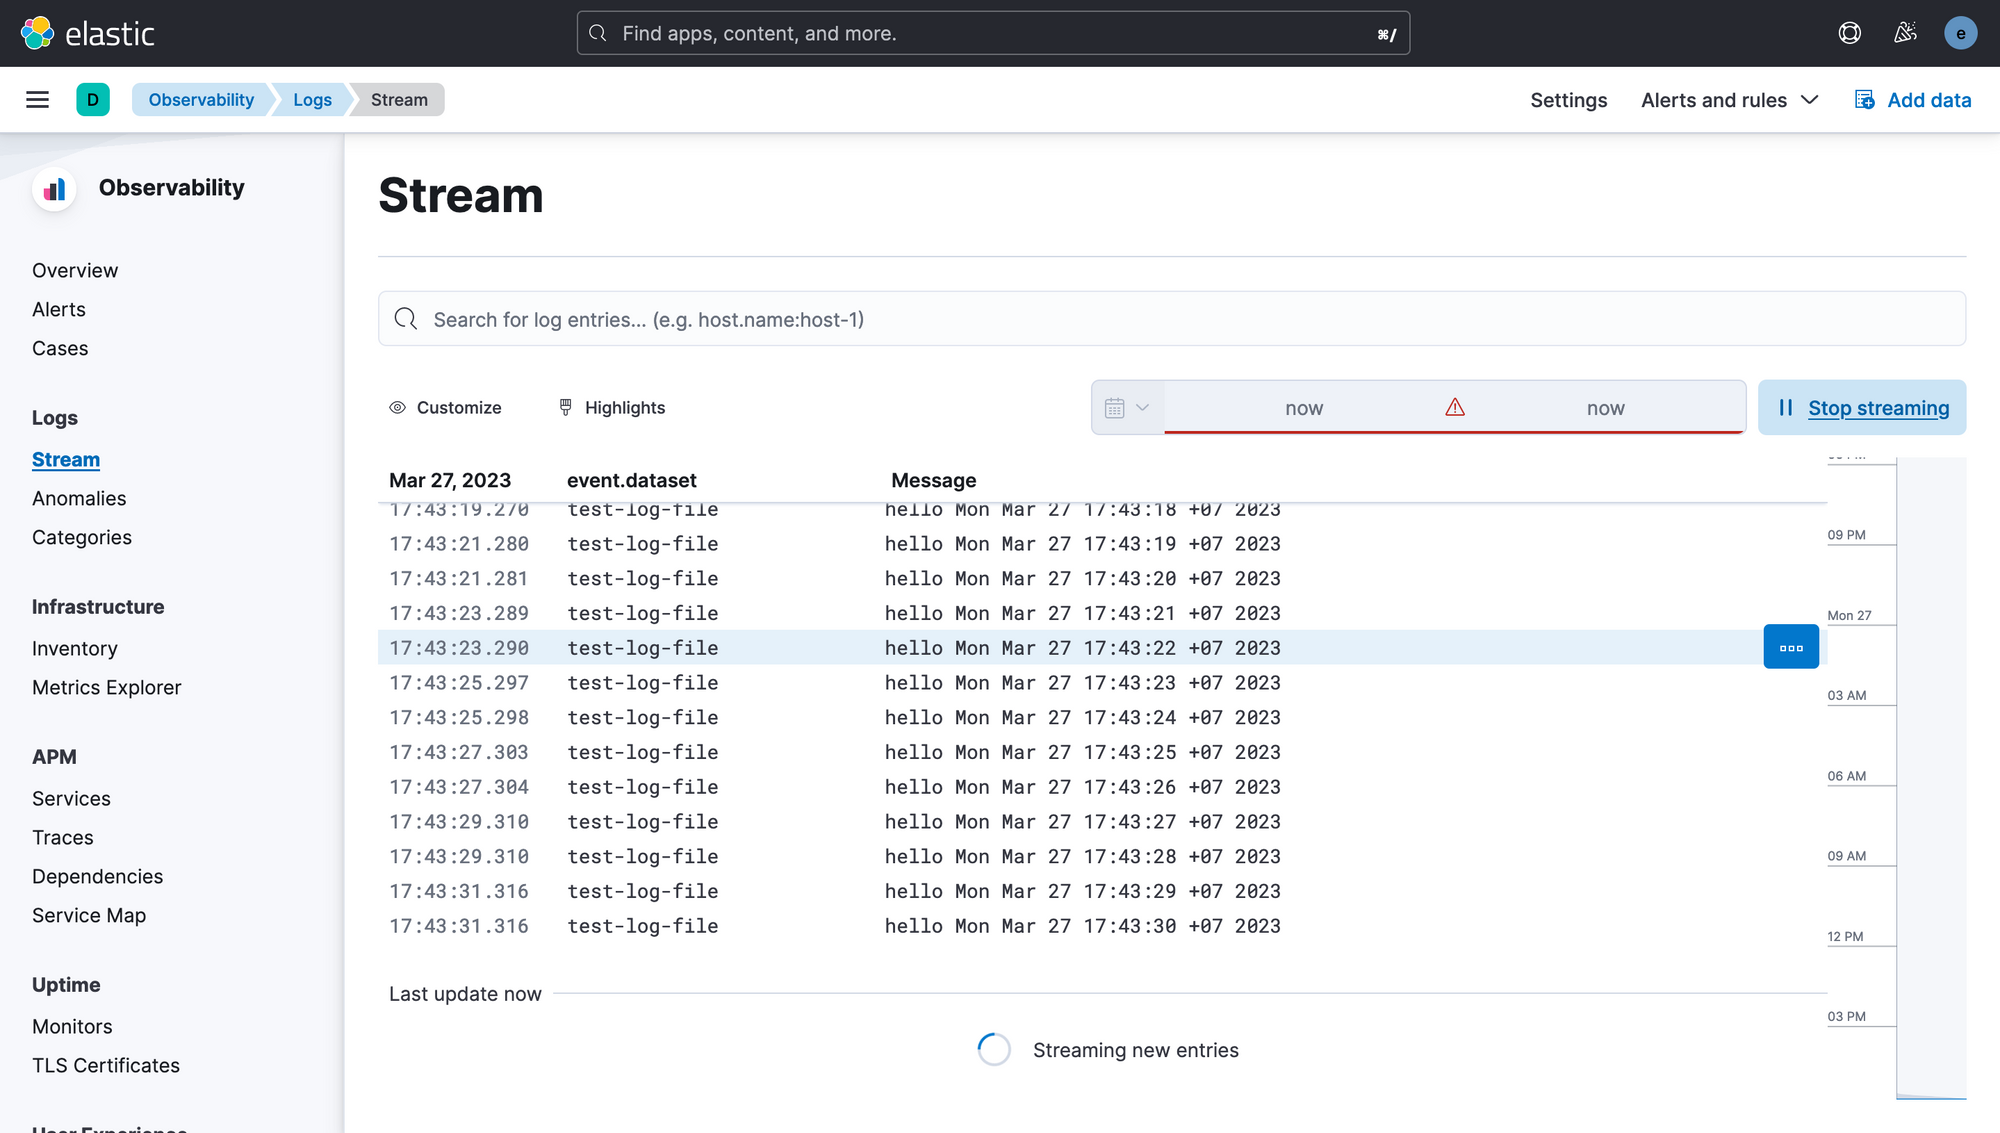
After waiting for some seconds, you will see that log was pushed to Elasticsearch and showing on Kibana.
When we have 5,6 services and several service instance, this approach is acceptable and easy to implement, to work with hundred and thousand container we need to push a LogStash before elasticsearch forfilebeat to be able to push to LogStash instead of elasticsearch.
You can find out more at here

Thank for reading the post.