What is Distributed Tracing?
Distributed tracing, also called distributed request tracing, is a method used to profile and monitor applications, especially those built using a microservices architecture. Distributed tracing helps pinpoint where failures occur and what causes poor performance.
Distributed tracing is the capability for a tracing solution to track and observe service requests as they flow through distributed systems by collecting data as the requests go from one service to another. The trace data helps you understand the flow of requests through your microservices environment and pinpoint where failures or performance issues are occurring in the system—and why.
For instance, a request might pass through multiple services and traverse back and forth through various microservices to reach completion. The microservices or functions could be located in multiple containers, serverless environments, virtual machines, different cloud providers, on-premises, or any combination of these.
Who Uses Distributed Tracing?
IT and DevOps teams can use distributed tracing to monitor applications. Distributed tracing is particularly well-suited to debugging and monitoring modern distributed software architectures, such as microservices.
Developers can use distributed tracing to help debug and optimize their code.
Why Does Your Business Need Distributed Tracing?
As new technologies and practices— cloud, microservices, containers, serverless functions, DevOps, site reliability engineering (SRE), and more—increase velocity and reduce the friction of getting software from code to production, they also introduce new challenges:
- More points of failure within the application stack
- Increased mean time to resolution (MTTR) due to the complexity of the application environment
- Less time to innovate because more time is needed to diagnose problems
For example, a slow-running request might be impacting the experience of a set of customers. That request is distributed across multiple microservices and serverless functions. Several different teams own and monitor the various services that are involved in the request, and none have reported any performance issues with their microservices. Without a way to view the performance of the entire request across the different services, it’s nearly impossible to pinpoint where and why the high latency is occurring and which team should address the issue.
As part of an end-to-end observability strategy, distributed tracing addresses the challenges of modern application environments. By deeply understanding the performance of every service—both upstream and downstream—your software teams can more effectively and quickly:
- Identify and resolve issues to minimize the impact on the customer experience and business outcomes
- Measure overall system health and understand the effect of changes on the customer experience
- Prioritize high-value areas for improvement to optimize digital customer experiences
- Innovate continuously with confidence to outperform the competition
How Does Distributed Tracing Work?
Distributed tracing starts with instrumenting your environment to enable data collection and correlation across the entire distributed system. After the data is collected, correlated, and analyzed, you can visualize it to see service dependencies, performance, and any anomalous events such as errors or unusual latency.
Instrumentation
Instrumenting your microservices environment means adding code to services to monitor and track trace data. You can also use open source tools and open instrumentation standards to instrument your environment. OpenTelemetry, part of the Cloud Native Computing Foundation (CNCF), is becoming the one standard for open source instrumentation and telemetry collection. Projects such as OpenCensus and Zipkin are also well established in the open source community. Some service meshes, such as Istio, also emit trace telemetry data.
Trace context
To make the trace identifiable across all the different components in your applications and systems, distributed tracing requires trace context. This means assigning a unique ID to each request, assigning a unique ID to each step in a trace, encoding this contextual information, and passing (or propagating) the encoded context from one service to the next as the request makes its way through an application environment. This lets your distributed tracing tool correlate each step of a trace, in the correct order, along with other necessary information to monitor and track performance.
W3C Trace Context is becoming the standard for propagating trace context across process boundaries. It lets all tracers and agents that conform to the standard participate in a trace, with trace data propagated from the root service all the way to the terminal service. New Relic supports the W3C Trace Context standard for distributed tracing.
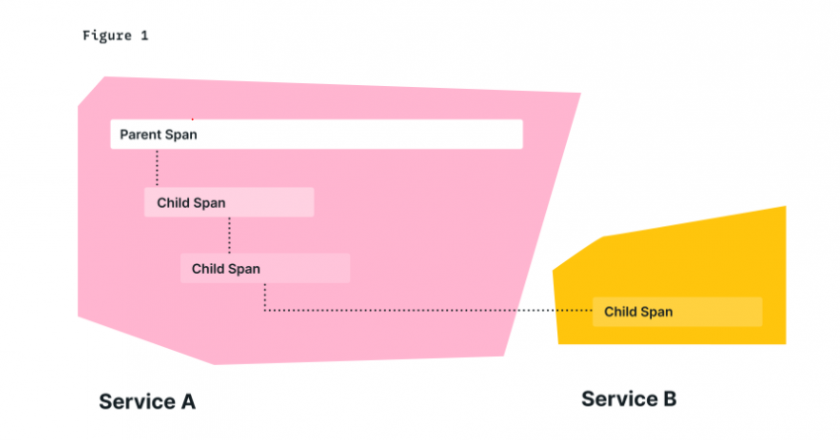
The diagram in Figure 1 represents a sample trace. A trace is a collection of linked spans, which are named and timed operations that represent a unit of work in the request. A span that isn’t the child of any other span is the parent span, or root span, of the trace. The root span describes the end-to-end latency of the entire trace, with child spans representing sub-operations.
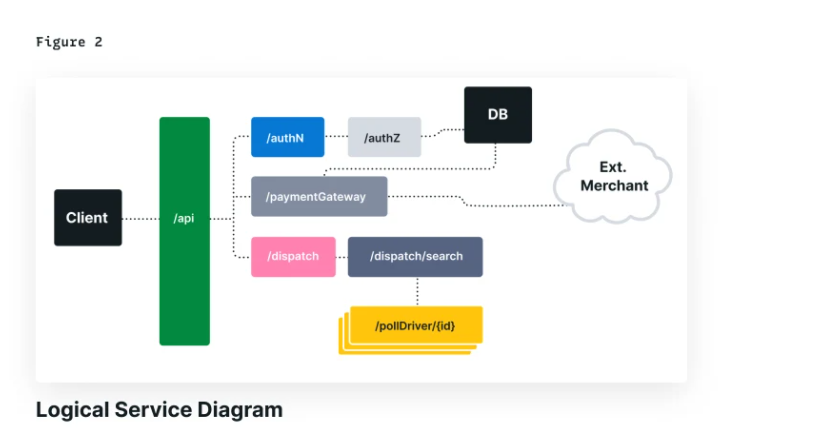
To put this in more concrete terms, consider the request flow of a system that you might encounter in the real world, a ridesharing app. When a user requests a ride, multiple actions begin to take place –– information is passed between services in order to authenticate and authorize the user, validate payment information, locate nearby drivers, and dispatch one of them to pick up the rider.
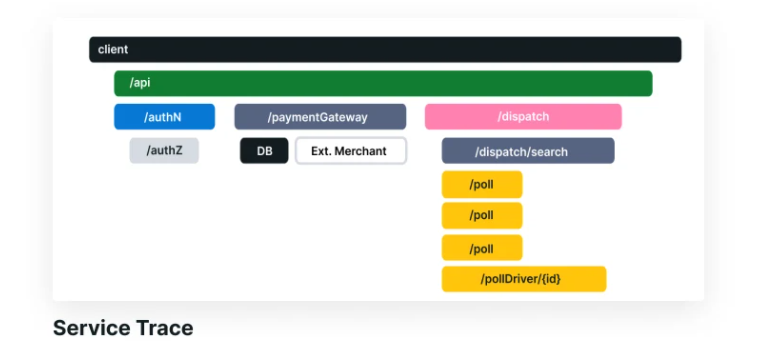
A simplified diagram of this system, and a trace of a request through it, appears in the following figure. As you can see, each operation generates a span to represent the work being done during its execution. These spans have implicit relationships (parent-child) both from the beginning of the entire request at the client, but also from individual services in the trace. Traces are composable in this way: a valid trace consists of valid sub-traces.
Tracing spans
To clear about spans context, we using OpenTelemetry for this explain.
Each span in OpenTelemetry encapsulates several pieces of information, such as the name of the operation it represents, a start and end timestamp, events and attributes that occurred during the span, links to other spans, and the status of the operation. In Figure 1, the dashed lines connecting spans represent the context of the trace. The context (or trace context) contains several pieces of information that can be passed between functions inside a process or between processes over an RPC. In addition to the span context, identifiers that represent the parent trace and span, the context can contain other information about the process or request, like custom labels. As mentioned before, an important feature of spans is that they are able to encapsulate a host of information. Much of this information, such as the operation name and start/stop timestamps, is required — but some is optional. OpenTelemetry offers two data types, Attribute and Event, which are incredibly valuable as they help to contextualize what happens during the execution measured by a single span.
Attributes are key-value pairs that can be freely added to a span to help in analysis of the trace data. You can think of Attributes as data that you would like to eventually aggregate or use to filter your trace data, such as a customer identifier, process hostname, or anything else that fits your tracing needs. Events are time-stamped strings that can be attached to a span, with an optional set of Attributes that provide further description. OpenTelemetry additionally provides a set of semantic conventions of reserved attributes and events for operation or protocol specific information. Spans in OpenTelemetry are generated by the Tracer, an object that tracks the currently active span and allows you to create (or activate) new spans.
Tracer objects are configured with Propagator objects that support transferring the context across process boundaries. The exact mechanism for creating and registering a Tracer is dependent on your implementation and language, but you can generally expect there to be a global Tracer capable of providing a default tracer for your spans, and/or a Tracer provider capable of granting access to the tracer for your component. As spans are created and completed, the Tracer dispatches them to the OpenTelemetry SDK’s Exporter, which is responsible for sending your spans to a backend system for analysis.
Tracing metrics
A single trace typically captures data about:
- Spans (service name, operation name, duration, and other metadata)
- Errors
- Duration of important operations within each service (such as internal method calls and functions)
- Custom attributes
Analysis and visualization
Collecting trace data would be wasted if software teams didn’t have an easy way to analyze and visualize the data across complex architectures. A comprehensive observability platform allows your teams to see all of their telemetry and business data in one place. It also provides the context they need to quickly derive meaning and take the right action, and work with the data in ways that are meaningful to you and your business.
Popular analysis and visualization tools such as: ELK stack with Open distro, Jeager, Zipkin, ...
What are the open distributed tracing standards (OpenTracing, OpenCensus, OpenTelemetry)?
OpenTracing and OpenCensus competed as open source distributed tracing projects that were recently merged into a single tool called Open Telemetry.
Hosted by the Cloud Native Computing Foundation (CNCF), OpenTracing attempts to provide a standardized API for tracing, enable developers to embed instrumentation in commonly used libraries or their own custom code without vendor lock-in. Though this provided much-desired flexibility, the API’s sole focus on tracing made it of limited use on its own and led to inconsistent implementations by developers and vendors.
OpenCensus was developed at Google and was based on its internal tracing platform. Once it was open sourced, Microsoft, along with other vendors and contributors, began directing the standard. OpenCensus is a set of multi-language libraries that collects metrics about application behavior, transferring that data to any backend analysis platform of the developer’s choosing. It can also trace messages, requests, and services from their source to their destinations. With no API available to embed OpenCensus into code, developers used community-built automatic instrumentation agents for the task.
Open Telemetry, which is managed by CNCF, merges the code bases of OpenTracing and OpenCensus, relying on the strengths of each. Currently in beta, OpenTelemetry offers “a single set of APIs, libraries, agents, and collector services” for capturing distributed traces and metrics from an application that can be analyzed using popular observability tools. In the near future, OpenTelemetry will add logging capability to its data capture support.
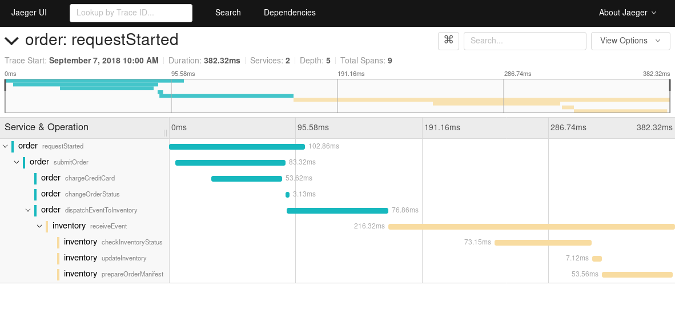
What is Jaeger or Zipkin tracing?
Jaeger and Zipkin are two popular open-source request tracing tools, each with similar components: a collector, datastore, query API, and web user interface. Outgoing requests are traced along with the application. The collector then records and correlates the data between different traces and sends it to a database where it can be queried and analyzed through the UI.
Jaegar and Zipkin are differentiated by their architecture and programming language support — Jaeger is implemented in Go and Zipkin in Java. Zipkin supports virtually every programming language with dedicated libraries for Java, Javascript, C, C++, C#, Python, Go, Scala, and others. Jaeger’s supported-language list is shorter: C#, Java, Node.js, Python, and Go.
What is a log in Kafka?
Kafka is a distributed streaming platform, providing a high-throughput, low-latency platform for handling real-time data feeds, often used in microservice architectures. It’s used to process streams of records in real time, publish and subscribe to those record streams in a manner similar to a message queue, and store them in a “fault-tolerant durable way.”
Kafka uses “topics” — a category or feed name to which records are published — to abstract streams of records. For each topic, Kafka maintains a partitioned log, an ordered, continually appended sequence of records that can serve as an external commit log for a distributed system.
Open distro for tracing with ELK stack
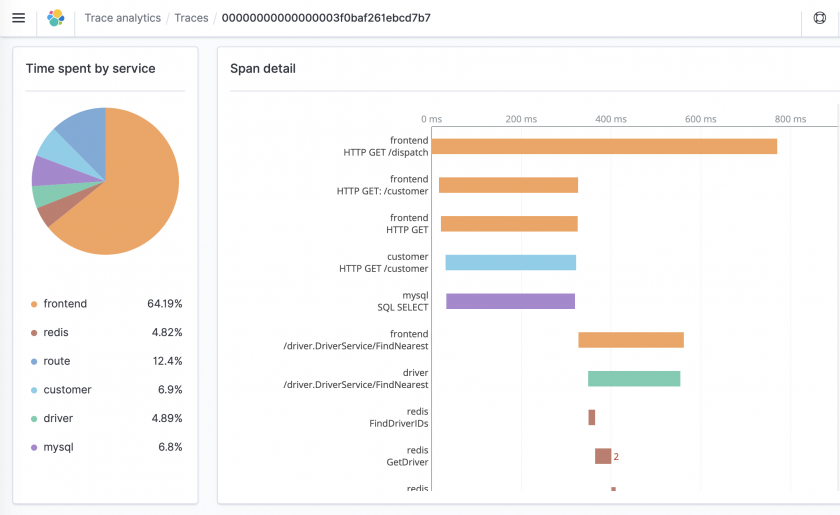
Trace Analytics provides a way to ingest and visualize OpenTelemetry data in Open Distro for Elasticsearch. This data can help you find and fix performance problems in distributed applications.
A single operation, such as a user clicking a button, can trigger an extended series of events. The front end might call a back end service, which calls another service, which queries a database, processes the data, and sends it to the original service, which sends a confirmation to the front end.
Trace Analytics can help you visualize this flow of events and identify performance problems.
More details: https://opendistro.github.io/for-elasticsearch-docs/docs/trace/
References: