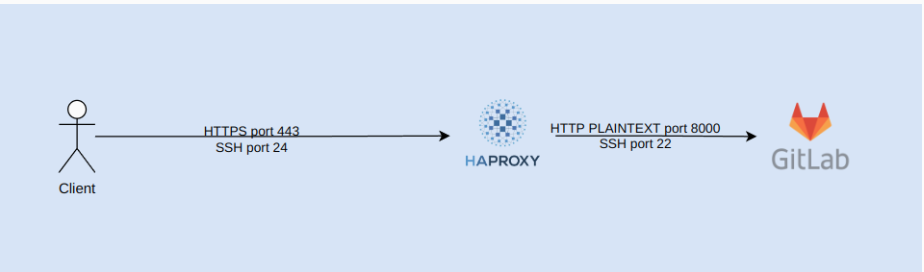
Monitoring containerized microservices with a centralized logging architecture.
Problems
We all know importance of logging in applications but it is even more crucial in distributed systems. There are challenges of logging in microservices architectures.
As the amount of services in a microservice architecture rises, complexity naturally also rises. Bugs and individual service failures can be very tricky to deal with and having to spend hours digging deep to find the root of an unnamed error can be a daunting and unproductive task.And they get even more complicated when one or more services fail.
- Which service failed?
- Why?
- And under what circumstances?
To effectively deal with the challenges of system errors, request chain breakdowns, or even simply to stay on top of your system architecture, logging is a vital tool. It is undeniable that it is the cornerstone of maintaining and debugging your app efficiently. All these questions are hard to answer if you don’t have good, meaningful logs.
Why we need a Centralized Log Management (CLM) for microservice architecture?

In the microservice pattern, thousands of services operate independently and are distributed across many different infrastructures with each service having different types of logs. Therefore we need a central control of these logs synchronously and centrally manage them. Ensure that when any errors arise, we can trace them and offer a quick and thorough solution.
In order to ease this entire process, many solutions such as a Centralized Log Management (CLM) solution comes into the picture.
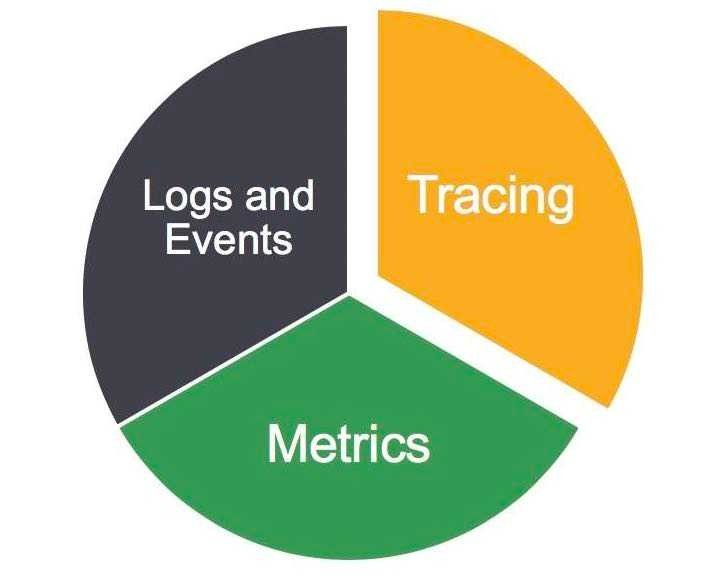
The CLM Pillars of Observability
Based on usage goals and lifecycle round, CLM divided logs data into 3 main categories:
- Metrics
- Logs & Events
- Traces
1. Metrics
Metrics probably represents the most valuable of the three monitoring tools because:
So many resources are designed to spit out various bits of health and performance information (and there are loads of tools to collect this information).
They are efficient.
They are frequently generated.
They are easily correlated across elements of your infrastructure.
Everything from operating systems to applications generate metrics which, at the least, are going to include a name, a time stamp and a field to represent some value. Since so many resources come ready to tell us about themselves, metrics is an obvious place to start when it comes to monitoring.
Most all metrics will enable you to tell if a resource is alive or dead, but if the target is valuable enough you’ll want to be able to ascertain what is actually wrong with the system or going wrong. As you can imagine, the latter will require detailed information about what is happening inside the system, so called white-box monitoring that relies on internal instrumentation. The more rudimentary black-box approach draws conclusions about the health of a system based on externally visible indicators (is it responding to any system calls?).
But perhaps the most important thing to understand about metrics is that last bullet about being able to correlate metrics across infrastructure components. Given the complex interdependencies common to IT environments today, the ability to stitch together metrics to get a bigger picture view is a real time saver. And it becomes even more critical as we move to cloud-native environments because of the dynamic nature of cloud infrastructure and the ever-changing relationship between that infrastructure and the applications.
An initial challenge of harnessing metrics is the variety of the information available and the number of tools needed to collect and make sense of that information. Then there is the question of how you store data in so many formats from so many resources. But the resultant upside more than makes up for the effort required to figure out how to harness the information.
It is also worth noting that, given there is no standard API for metric collection, many organizations use agents to collect data that is either pushed to a central location for analysis or pulled by that central resource. Gartner says agents frequently referenced by customers include push agents Collectd and Telegraf, while Prometheus is cited as a tool to pull information from targets.
2. Logs & Events
Logs are perhaps the second most important tool in the monitoring toolbox because virtually everything logs information about what they are doing at any given time. What’s more, logs tend to give more in-depth information about resources than metrics. So, if metrics showed the resource is dead, logs will help tell you why it died.
The problem with logs is there can be too much of a good thing. With everything in your environment tracking what they are doing and anxious to share that information, it is easy to see how that could result in a mountain of data. Instead of streamlining the monitoring process, you are simply creating a big new centralized haystack.
And like metrics, differences in log formats and the abundance of tools available to collect and make sense of logs, complicates the job of getting the most out of this rich trove of material. There are, however, a number of common tools used for collecting logs, such as syslog and open source tools such as Fluentd.
The trick to getting the most out of these tools is limiting what you collect to keep it manageable, and, where possible, to home in on common fields so you can more easily find the needles in the haystack.
3. Traces
Last but not least in the monitoring triangle is application trace data, which “traces” information about specific application operations. With so many application interdependencies these days, these operations will typically involve hops through multiple services (so called spans).
Traces, then, add critical visibility into the health of an application end-to-end. They are, however, solely focused on the application layer and provide limited visibility into the health of the underlying infrastructure. So, even if you collect traces, you still need metrics to get the full story of your environment. APM tools feed trace information to a centralized metrics store, so traces provide a nice source of data for an app-centric view.
The need for the viewpoint that traces can provide is exacerbated in container-based microservice architectures that are nothing more than a collection of stitched together services. These environments can be addressed with something called distributed tracing.
References: